Over the past 16 months, Software Supply Chain Risks have risen to a top concern of CISOs, caused by several software supply chain attacks as well as major risks induced by vulnerabilities in extensively used standard software components, specifically Log4j/Log4shell. Understanding and mitigating software (supply chain) risks as well as protecting the own DevOps pipeline is a must for organizations. This is not a one-time exercise but requires continuous re-evaluation based on standardized methodology. Risks are continuously changing, be it by newly detected vulnerabilities or by external events such as the recent addition of Kaspersky Lab to the FCC covered list in the U.S. and the preceding warning of the German BSI of using Kaspersky anti-malware solutions.
The FCC covered list contains communication equipment and services “deemed to pose an unacceptable risk to the national security of the United States or the security and safety of United States persons”. The BSI warning is based on the combination of extensive system-level entitlements of the software and a lack of control about which actions might be taken to systems by the software. These actions have been preceded by a directive issued in 2017 by the U.S. Department of Homeland Security, mandating civilian federal government agencies to remove Kaspersky software.
Assessing the risks of software requires a methodology, a structured approach. The recommended approach here is to start with a set of criteria for measuring the risk (as probability x impact). The eight areas to look at are
Such rating then can be done for software categories, as shown in the spider chart, or for specific software. It, e.g., can be used for first defining a baseline and then comparing different vendor’s solutions.
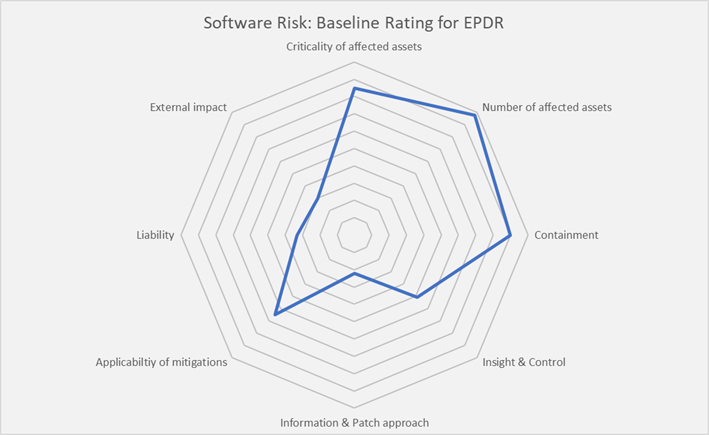
For EPDR (Endpoint Protection, Detection & Response), which serves as the example in the spider chart, there is an obvious inherent risk. EPDR protects endpoints, which also means that software risks in EPDR affect endpoints, making them vulnerable and potential entry points for attacks. The number of affected assets is significant. Containment of risks is difficult, because endpoints are everywhere across the organization. Insight & control is, across the range of EPDR solutions, mediocre, with a lot of automation based on cloud services, both changing the endpoint software & configuration (such as updates on signatures of malware, to take a classical example), and gathering information. Information about risks and patch management approaches of vendors commonly are good, imposing little risk. The applicability of mitigations is fairly limited and primarily is about either using multiple tools per endpoint, or replacing EPDR solutions, both being complex and costly mitigation approaches. Liability for damages caused by attacks is reduced by proper use of EPDR solutions. Finally, there is no significant external impact on the risk in common scenarios.
However, this standard, baseline evaluation then must be adapted to the concrete software in use. And if, such as with the above-mentioned warnings and bans of a software, external impact changes, there also needs to be a re-evaluation. In the concrete case, the risk rating for
are increasing massively, to the top-level of the rating. Also, the risk rating for Information & patch approach, and for Insight & Control must become revisited. Also, the rating for Applicability of mitigations changes: Is it practical to just add some more controls based on other vendor’s solutions, or is the only consequence to switch to another vendor’s solution? Based on the changes in risk rating, decisions must be made, and consequences must be taken.
For comparing the Risk/Benefit ratio or the Risk/Feasibility ratio of software, matrixes are a proven tool for graphical representation. In a Risk/Benefit ratio, the risk of software would be measured again the benefit it provides. In such ratio, different solutions or different types of software can be compared. It, e.g., can serve for comparing the Risk/Benefit ratio of various security solutions, to better understand where to spend the (always limited) budget for. The matrix also can be used for re-evaluating the risk of software.
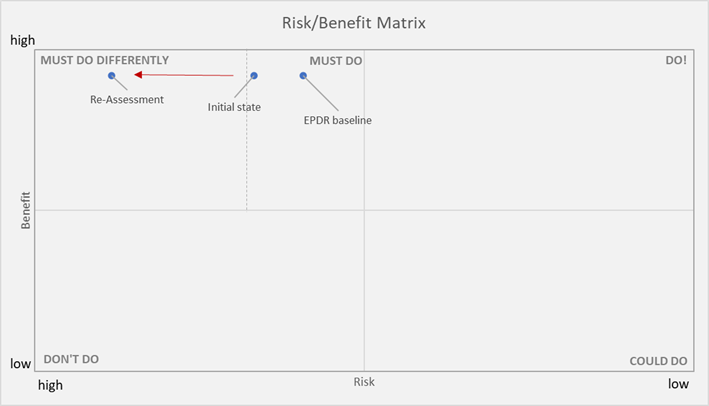
The sample indicates how a certain software rated compared to the baseline, and how the re-assessment based on external factors impacts this rating. The matrix has four quadrants, with low risk/high benefit being in the upper right, indicating what organizations definitely should do. EPDR is in the upper left quadrant, with some inherent risk, but a huge benefit. Which technologies are used here must be very carefully considered, due to the inherent risk, but implementing, in this sample, EPDR, is a must-do. However, the dotted line indicates where we shift from something that must be done to something that requires an alternative.
As the example illustrates, the rating between baseline and concrete software solutions can differ. If it moves towards the right, applying a technical solution remains a must do, but the concrete solution must be re-evaluated, specifically if the gap in risk towards the baseline rating becomes that big, and a solution shifts from “must do” to “must do differently” (or “must be done differently”).
The lower left quadrant would contain solution with limited benefit and high risk. These shouldn’t be used. The lower right quadrant is about low risk/low benefit, i.e., the nice-to-have solutions.
An important aspect in these ratings is the factor of “applicability of mitigations”. If you can mitigate risks for a software or service by additional measures, some or all of the other factors will change to the positive, i.e., a lower risk. If you can only mitigate by replacement, it is about comparing the current solution with the alternatives that, in the example would score closer to the EPDR baseline rating. Unless you want to take the risk…
The recommendation is to always take structured approaches and use defined methodologies ahead of making decisions. This helps in clarifying the real risk and the changes in risk as well as potential mitigations, and thus backs the decisions that must be made. Sometimes, the decisions to be made then become obvious.